Skip to content
Costing & Architecture11 min readPublished 2026-09-18

Calculating Material Yield Variance in Chemical Production

Practical guide to chemical yield calculations. Learn the mathematical formula for isolating yield variances from input mix differences in batch processing.

AK

Abhishek Kumar

Senior Finance & ERP Systems Architect, Werkora

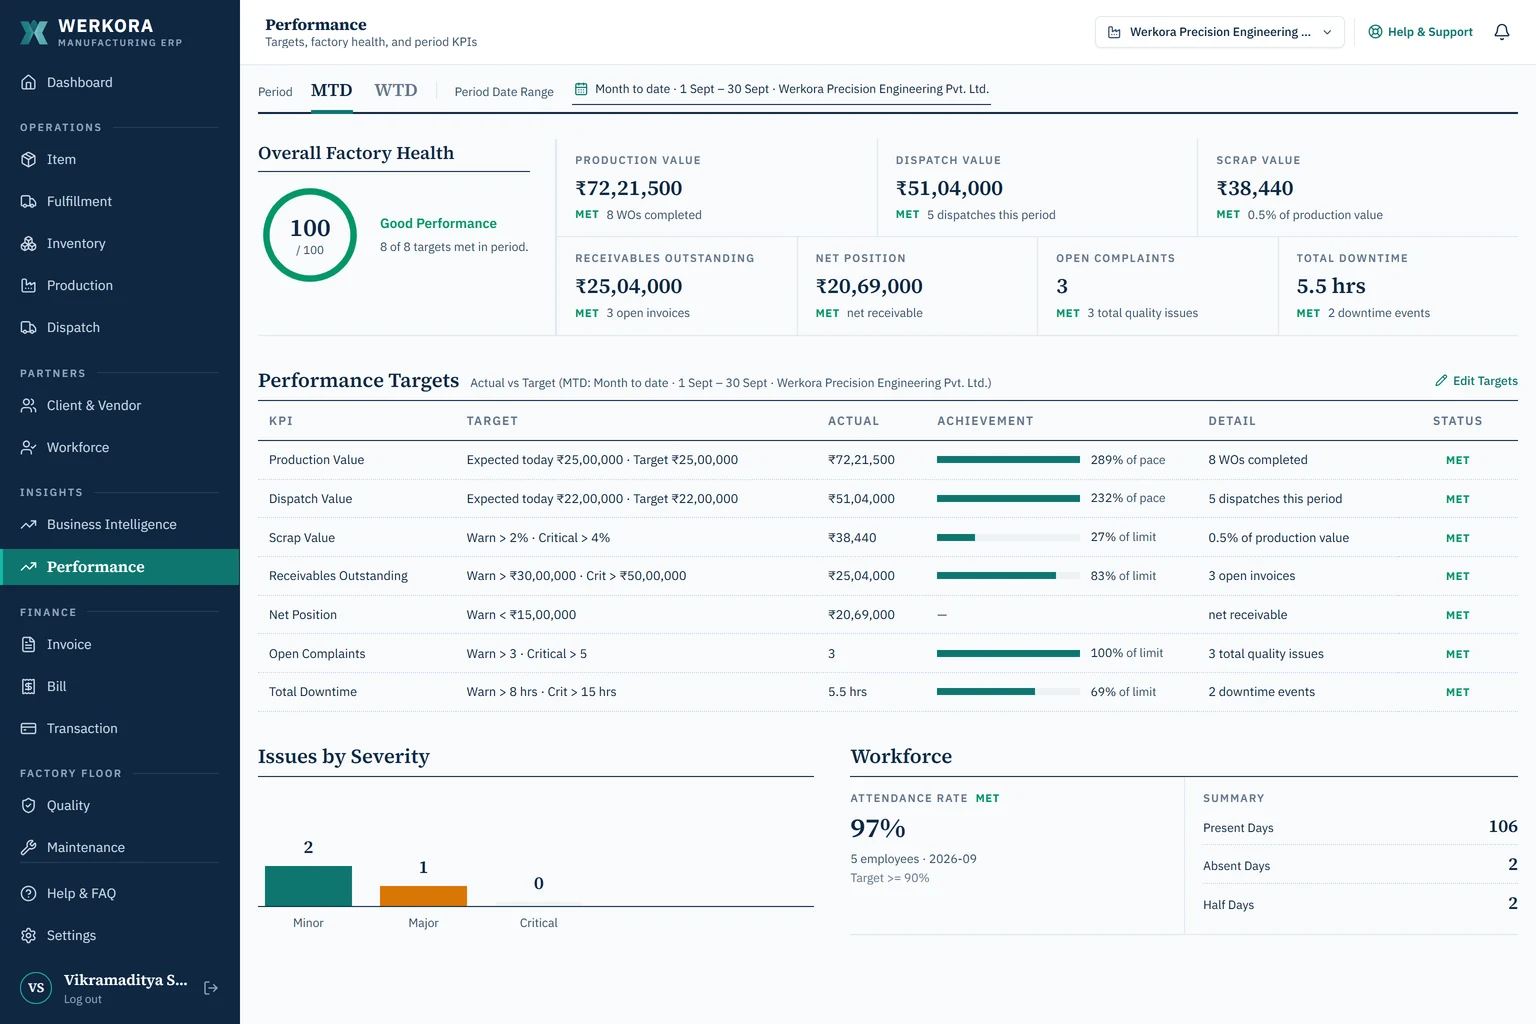
Werkora performance module — cost and variance reporting
AEO Quick Answer & Key Takeaway

Material Yield Variance isolates the difference between the standard output expected from raw material inputs and actual finished output produced: Formula = Standard Cost per Unit × (Actual Yield - Standard Yield). In chemical production, distinguishing yield variance from material mix variance pinpoints whether losses were caused by sub-optimal reaction conditions or ingredient substitutions.

The Mathematical Formula for Yield Variance

In continuous and batch processing, chemical yields rarely match theoretical equations. The standard formula for Material Yield Variance is: Yield Variance = Standard Unit Output Rate × [Actual Batch Output - Expected Standard Output]. When actual output falls short of expected yield, an unfavorable variance is booked to manufacturing variance accounts.

Separating Material Mix Variance from Yield Variance

Plant engineers often substitute lower-grade solvents when preferred feedstocks are unavailable. If a cheaper solvent reduces the final distillation yield, standard cost sheets attribute the loss to floor operators unless the ERP separates mix variance from pure chemical conversion yield variance.

Root Causes: Temperature, Purity, and Reaction Time

Tracking yield variances across production runs highlights operational patterns: variations in ambient boiler pressure, cooling tower efficiency, or catalyst degradation. Linking quality lab assays with ERP batch records isolates physical causes from chemical degradation.

Automated General Ledger Posting in Werkora

Werkora posts favorable and unfavorable variances directly to general ledger clearing accounts at batch closure, providing plant directors with instant financial visibility into chemical conversion efficiency.

Stop paying per-user software taxes in your factory

Werkora equips every shop-floor supervisor, line operator, storekeeper, and accountant with their own dedicated login with plans sized for your operation.

Frequently Asked Questions

Expert Answers for Factory Operations

What is the difference between mix variance and yield variance?

Mix variance measures cost differences caused by altering the proportion of ingredients used, whereas yield variance measures the difference in physical output produced from the total input volume.

How does Werkora track chemical batch losses?

Werkora logs raw ingredient weights at reactor charging and compares final drummed weight against theoretical stoichoimetric yields.

AK

Abhishek Kumar

LinkedIn Profile

Senior Finance & ERP Systems Architect, Werkora

Senior accountant and enterprise systems specialist with 9+ years of experience across Indian GST/TDS compliance, SAP S/4HANA, Tally Prime, and finance automation. Direct operational background in precision instruments manufacturing and multi-jurisdictional statutory compliance with a zero-penalty record.

Cite this guide
APA, Markdown or BibTeX

Copy a citation to include this guide in your article or report.

Interactive Cost Comparison

Calculate Your Plant's Licensing Savings

Benchmark your current software bills against Werkora's unit-based pricing (10 users/unit · min 3 units).

Projected 3-Year Savings for Your Operation (3 Factory Units · 30 Users)

Save up to ₹6.8 Lakhs over 3 years

Compared to standard per-user seat pricing models like ERPNext ($13.50/user/mo).

Each unit includes 10 active user seats (Operations, Store, Accounts, Planning).

3

Base commitment minimum is 3 units (30 user seats total).

Commitment Term:

Werkora Plan

Werkora

₹14,997/mo (3 Units · 30 Seats)

Annual Cost

₹1,79,964

3-Year TCO

₹5,39,892

30 user seats (3 units × 10)

ERPNext Cloud

$13.50 / user / mo

Annual Cost (30 Users)

₹4,05,816

3-Year TCO

₹12,17,448

Save ₹6.8 Lakhs

TYASuite

₹499 / user / mo (~$6)

Annual Cost (30 Users)

₹1,79,640

3-Year TCO

₹5,38,920

Save ₹0

Zoho Creator

$8 / user / mo

Annual Cost (30 Users)

₹2,40,480

3-Year TCO

₹7,21,440

Save ₹1.8 Lakhs

SAP Business One

$50+ / user / mo

Annual Cost (30 Users)

₹15,03,000

3-Year TCO

₹45,09,000

Save ₹39.7 Lakhs

What's Included in Werkora's Plan (from ₹4,999/unit/mo · Min 3 Units):

10 Users per Factory Unit (30 Users in Base)
Minimum 3 Factory Units Included
GST Tax Invoices & Delivery Challans
BOM Formulation & Scrap Accounting
Customer, Supplier & Ledger Accounting
Batch FIFO Inventory Valuation
Shop Floor Travelers & Operation Routing
Extra Units at ₹4,999/mo (+10 users each)

Plan your ERP budget

Review the ERP buying guide or contact us to discuss the units, users, and deployment options your factory needs.

Related Manufacturing Playbooks

Explore adjacent topics in factory operations, costing, and statutory GST compliance.